Federal small business contract spending fell to $176.2 billion in fiscal year 2025. That is a 2.1 percent drop from FY2024. As a result, the small-business share of all federal contracting slipped to 22.6 percent, the lowest of the last five years. The figures come from transaction-obligation data pulled directly from USASpending.gov, rather than from a summary someone else wrote.
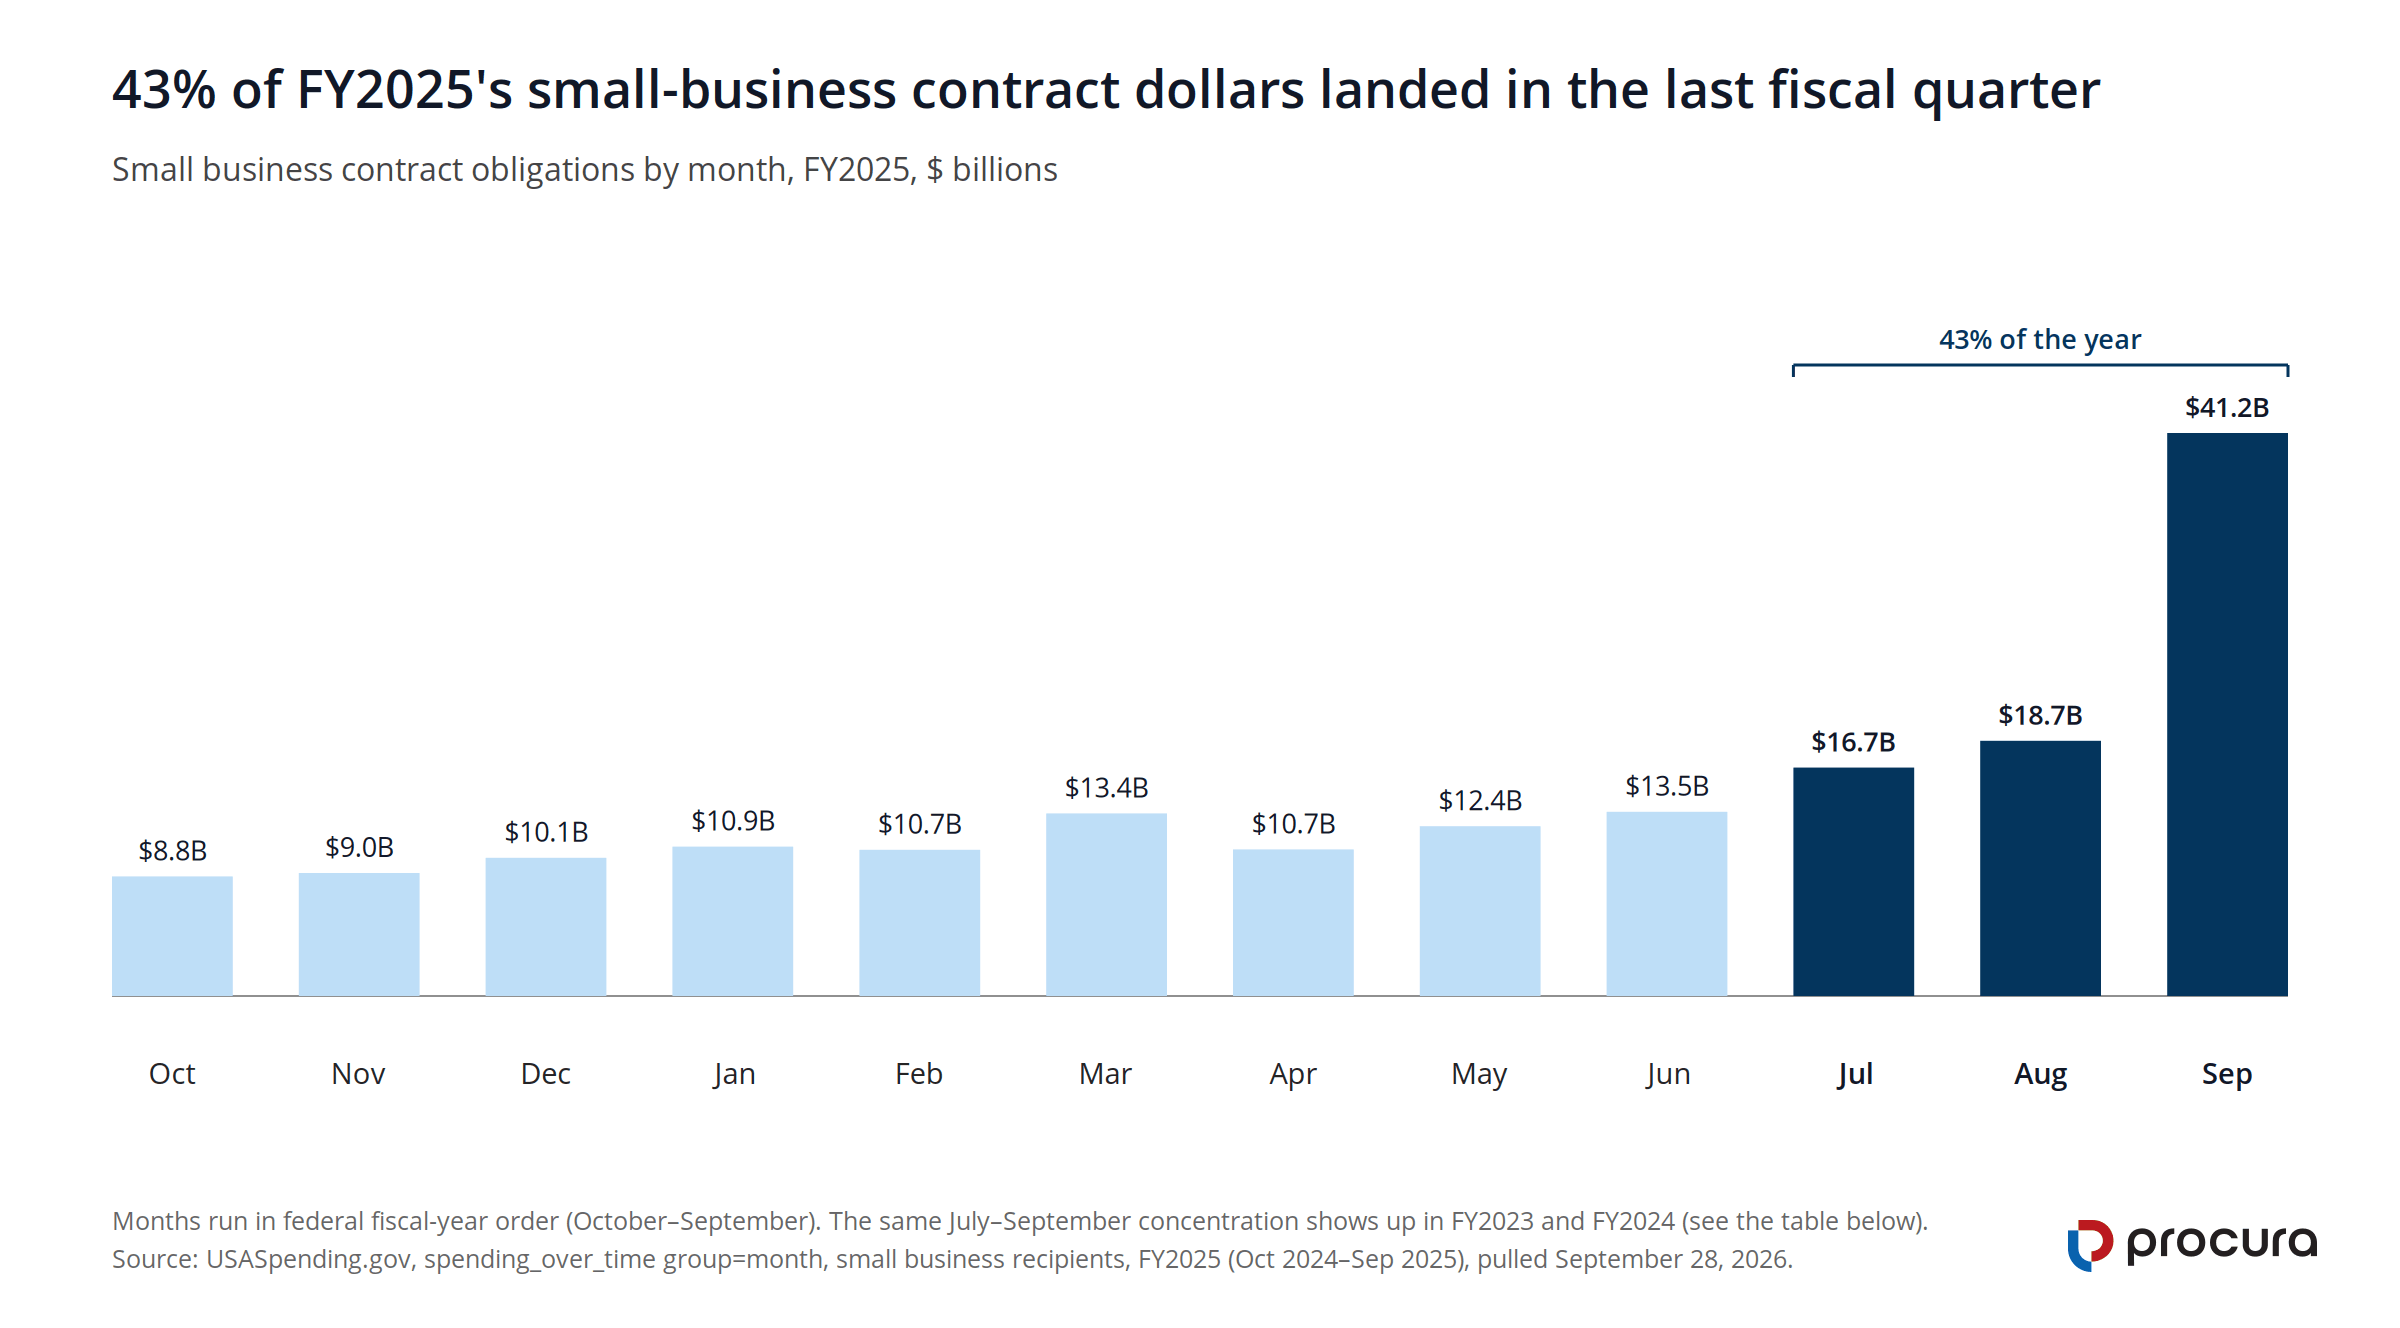
The same data also holds a second finding. Federal small business contract spending concentrates hard at fiscal year-end. In fact, 43 percent of it lands in the government’s last fiscal quarter, July through September. Nearly a quarter of the whole year lands in September alone. Moreover, the pattern held for three straight fiscal years.
I pull this data every quarter for guide-series articles and client conversations. This time, however, the numbers earned a study of their own. So what follows is every query, every figure, and a bid calendar you can build from it.
How much did federal small business contract spending fall in FY2025?
Small businesses took in $176.2 billion of the government’s $778.5 billion in contract obligations in FY2025. That is down from $180.0 billion of $740.7 billion in FY2024. Although total federal contracting grew 5.1 percent that year, small-business dollars fell.
The small-business share therefore fell from 24.3 percent to 22.6 percent in a single year. It now sits below every one of the four years before it.
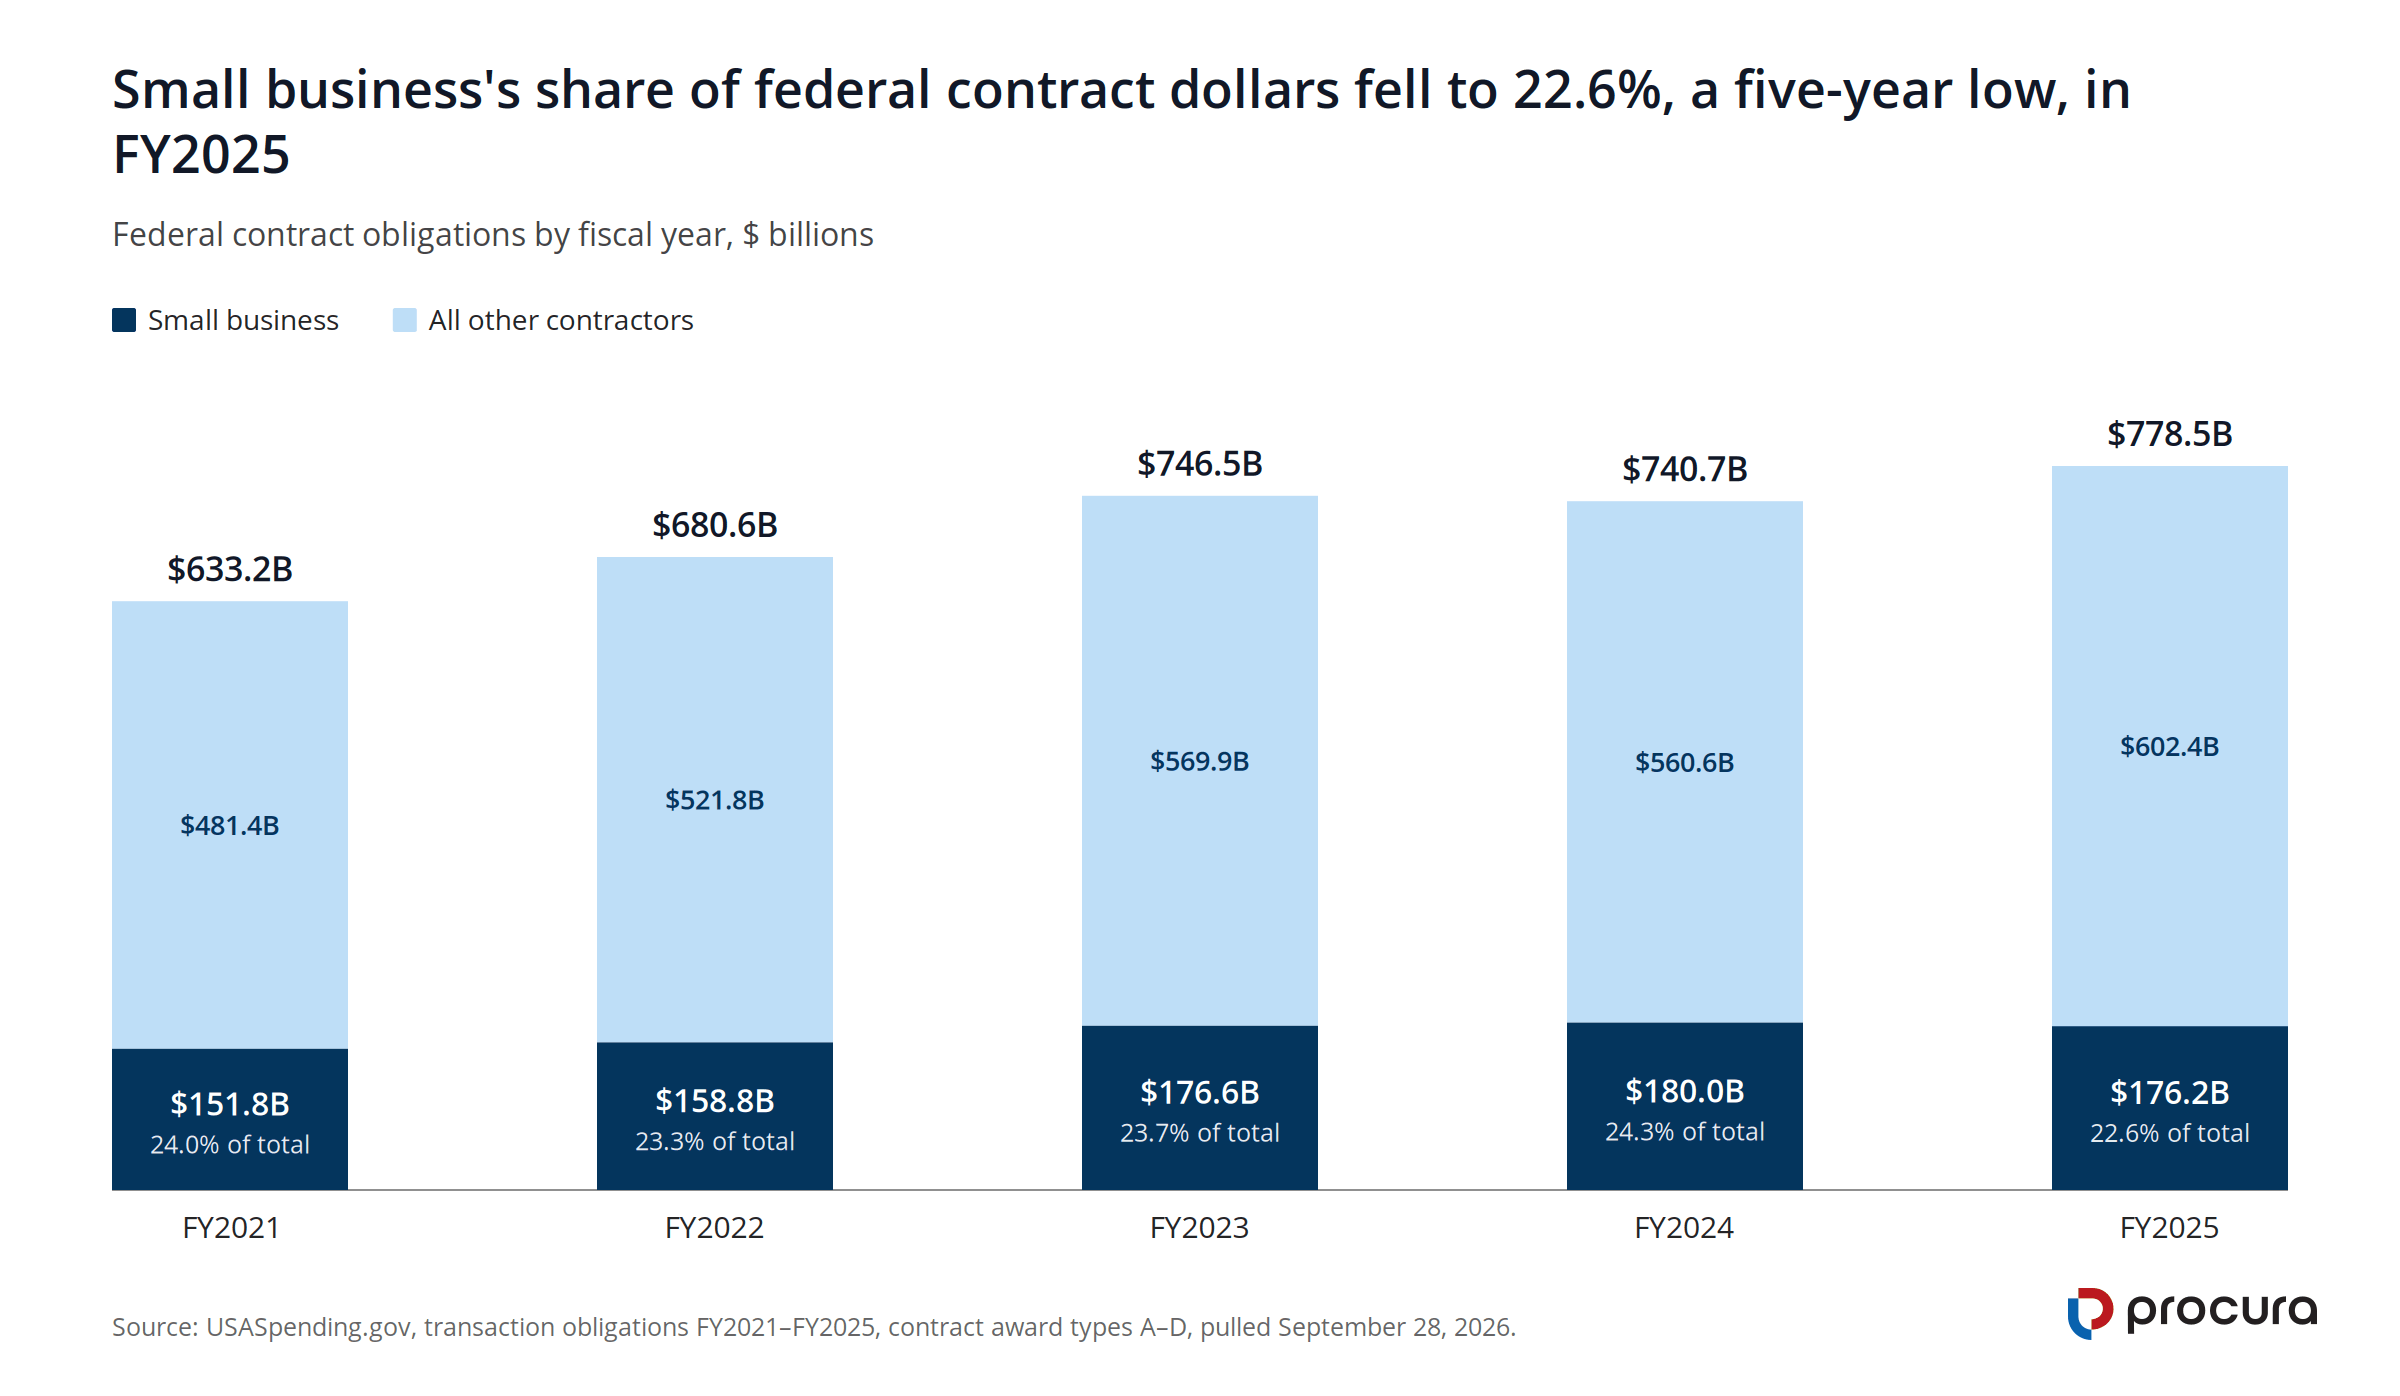
Data table: federal and small business contract obligations by fiscal year, FY2021–FY2025
| Fiscal year | Small business obligations | All other contractors | Total federal contract obligations | Small business share |
|---|---|---|---|---|
| FY2021 | $151.8B | $481.4B | $633.2B | 24.0% |
| FY2022 | $158.8B | $521.8B | $680.6B | 23.3% |
| FY2023 | $176.6B | $569.9B | $746.5B | 23.7% |
| FY2024 | $180.0B | $560.6B | $740.7B | 24.3% |
| FY2025 | $176.2B | $602.4B | $778.5B | 22.6% |
Two notes belong with that table, especially for anyone citing it. First, it runs on transaction obligations. That basis includes contract modifications, so it runs higher than a “new prime awards only” count.
Second, the SBA’s own FY2025 procurement scorecard reports a $179 billion prime-contract figure. That figure uses a different basis, new prime awards rather than the full obligation stream this pull measures. Still, the two figures move the same direction and tell the same story.
Cite the SBA figure when you need the official scorecard. Cite USASpending’s obligation basis, stated as such, when a reader needs to reproduce the figure independently. This article does the second.
When does federal small business contract spending peak?
This finding changes how a bid calendar looks, especially for a small team. When you break FY2025’s $176.2 billion in small-business obligations out by month, the pattern jumps out. Of that total, 43 percent, or $76.6 billion, obligated in the final quarter of the fiscal year, July through September.
September alone carried $41.2 billion, close to a quarter of the entire year. Meanwhile, the first half of the fiscal year, October through March, carried barely a third of the total.
Did FY2023 and FY2024 follow the same pattern?
The obvious question, then, is whether FY2025 was unusual. It was not. In fact, FY2023 and FY2024 show the same shape, within a couple of points.
| Month (fiscal-year order) | FY2023 | FY2024 | FY2025 |
|---|---|---|---|
| October | $6.4B | $7.4B | $8.8B |
| November | $8.3B | $9.1B | $9.0B |
| December | $9.8B | $10.0B | $10.1B |
| January | $9.4B | $9.3B | $10.9B |
| February | $10.7B | $11.1B | $10.7B |
| March | $16.0B | $12.5B | $13.4B |
| April | $12.6B | $12.2B | $10.7B |
| May | $14.9B | $15.5B | $12.4B |
| June | $14.6B | $15.0B | $13.5B |
| July | $14.2B | $17.9B | $16.7B |
| August | $20.1B | $20.8B | $18.7B |
| September | $39.7B | $39.2B | $41.2B |
| Jul–Sep share of the year | 41.9% | 43.3% | 43.5% |
The small-business slice of the market runs more back-loaded than federal contracting overall. In other words, it is not just as back-loaded. Total federal obligations across all recipients put 37.3 percent of FY2025 in that same July through September window. Small business recipients, however, put 43.5 percent of the year in the same window.
Agencies clear out expiring appropriations before September 30 every year, a known pattern across the whole government. This data also adds one fact to that pattern. The small-business channel feels it harder than the market as a whole, six points harder in FY2025.
Which agencies drive federal small business contract spending?
One buyer drives most of the number above. The Department of Defense obligated $102.6 billion to small businesses in FY2025. That is 58.2 percent of every small-business federal contract dollar. In fact, the next nine agencies combined do not equal the Department of Defense alone. Overall, the top 10 agencies together hold 90.9 percent of all small-business obligations.
| Awarding agency | FY2025 small business obligations | Share of all small business dollars |
|---|---|---|
| Department of Defense | $102.6B | 58.2% |
| Department of Veterans Affairs | $12.9B | 7.3% |
| Department of Homeland Security | $9.8B | 5.6% |
| Department of Health and Human Services | $7.5B | 4.2% |
| Department of Agriculture | $7.1B | 4.0% |
| General Services Administration | $6.3B | 3.6% |
| Department of the Interior | $3.8B | 2.1% |
| Department of State | $3.6B | 2.0% |
| Department of Transportation | $3.3B | 1.9% |
| Department of the Treasury | $3.3B | 1.9% |
A small business whose federal revenue tracks defense spending feels the July through September crowding hardest. That is because the Department of Defense sets the pace for the whole small-business number. A firm selling mainly to civilian agencies, VA or HHS for example, still sees a September spike. However, it runs less sharp.
How was this data pulled?

Every figure in this article came from the USASpending.gov API at api.usaspending.gov. None came from a summary, a news article, or another site’s chart, so anyone can check them at the source. The basis is transaction obligations, contract award types A through D.
Those types are definitive contracts, purchase orders, delivery orders, and BPA calls. They also include modifications and de-obligations. For the small business figures, the pull then filters on recipient_type_names: small_business.
Yearly figures group by fiscal year. Similarly, monthly figures group by month, which the API returns in federal fiscal-year order starting with October. FY2025 is a complete fiscal year. It closed September 30, 2025, with no reporting lag. As a result, none of the totals above will move as more transactions post.
Five queries produced every number in this article. First, a spending_over_time call grouped by fiscal_year covered FY2021 through FY2025, run once unfiltered and once with the small-business filter. Then a spending_over_time call grouped by month covered FY2023, FY2024, and FY2025, each with the small-business filter.
Another month-level pull, unfiltered, covered FY2025 for the all-recipient comparison. Finally, a spending_by_category call on awarding_agency covered FY2025 with the small-business filter. Every call, and the raw data it returned, is archived with the pull date above. You are also free to cite this page with credit and a link back here.
What does the fiscal year-end rush mean for your bid calendar?

Two things follow from this data, and neither is complicated. First, a business-development calendar that treats every month the same is wrong by a factor of five.
October carried $8.8 billion in small-business dollars in FY2025, while September carried $41.2 billion. So a team that quiets down over the summer, on the belief that the government is not buying, has it backward. In fact, the government is about to obligate almost half its yearly small-business spending in the next ninety days.
Why manual solicitation review falls behind in the rush
Second, that same rush brings more solicitations, more amendments, and more incumbents racing to recompete work before funding expires, all in the same eight-week window. As a result, a team that reads solicitations by hand loses days it does not have, in exactly the period this data says matters most. That gap is also one reason small businesses lose winnable federal work, a pattern I cover in more depth in why small businesses lose federal contracts.
That is the problem Procura Federal solves for GovCon small businesses. It watches every new posting the moment it lands. Then it opens the attachments and scores the opportunity against your capability statement, at $399/month.
In a normal March, that saves a team a few hours a week. During the July through September window this article describes, however, the stakes rise. So the time saved becomes the gap between finding an opportunity on day one and finding it after the incumbent already won it back.
If you have not yet registered on SAM.gov, this same season also carries the most set-aside dollars. The same goes if you are weighing 8(a) or HUBZone certification against the paperwork it takes.
What this data cannot tell you
This data does not explain why small business’s overall share slipped in FY2025. That is a separate, harder question, because it touches budget politics, set-aside goal-setting, and agency-by-agency choices this study cannot answer.
Still, the data does say one thing plainly: fewer relative dollars are available, and more of them arrive in a compressed window. Read together, that is a case for showing up earlier in the fiscal year. It is also a case for keeping a pipeline active before the rush starts, not after. The set-aside search built into Procura targets exactly that mismatch, between when opportunities post and when a small BD team has time to read them.
Frequently asked questions about federal small business contract spending
Why did small business’s share of federal contracting fall in FY2025?
This data shows that the share fell, from 24.3 percent in FY2024 to 22.6 percent in FY2025. However, it does not show why. Total federal contracting grew 5.1 percent that year while small-business dollars fell slightly, so the share compressed from both sides at once. Agency-level goal setting, budget timing, and individual large awards plausibly all play a part. Still, separating them out needs award-level analysis beyond the scope of this study. In addition, one factor is worth watching for next year’s figures: the SBA’s own 8(a) program terminations, which remove firms from the program mid-year.
Is the September spending spike unique to small business contracts?
No, and it is not unique to FY2025 either. Federal spending overall concentrates near fiscal year-end because appropriations expire September 30. This data shows that the small-business channel concentrates even harder than the market as a whole. For example, 43.5 percent of small-business dollars landed in the last quarter of FY2025. On the other hand, only 37.3 percent of all federal contract dollars did the same.
Does “small business contract spending” here include grants or subcontracts?
No. Every figure in this article is prime contract obligations, award types A through D, to recipients USASpending.gov classifies as small business. Grants use separate award-type codes, so they are excluded. Subcontract dollars are not tracked separately in USASpending, so they are also excluded. That means the true small-business share of federal work, prime plus subcontract together, runs higher than the 22.6 percent this article reports.
Where can I pull updated numbers myself?
USASpending.gov’s award search and its public API at api.usaspending.gov are free. They also require no account. For example, the spending_over_time endpoint, grouped by fiscal_year or month with a recipient_type_names: small_business filter, reproduces every figure in this article.
Get eyes on the opportunities that post during the rush
Book a working session, and we will check your NAICS codes against this same data, live. Then you will see which agencies and which months matter most for your pipeline. The session takes fifteen minutes and costs nothing.